Taken with the iPhone.

Radio City Music Hall is celebrating its 75th Anniversary.

Big signs at Times Square.

Is this a notice to caution the rats? Or are there a bunch of rats whose job it is to go around issuing cautions?

At the Richard Rogers Theatre waiting for Cyrano de Bergerac to start. Our seats were on the front row on the aisle. It was as if they blocked the show for us there…fantastic.

Times Square ticker after the show.

Taken while running the gauntlet.
Month: November 2007
surprised Anne with a trip to New York this morning. Glad the strike is over…we’re waiting for the curtain of Cyrano de Bergerac with Kevin Kline and Jennifer Garner right now.
BBC NEWS | Science/Nature | Australians named worst emitters
This article claims that the Australians are the worst emitters on the planet, because they emit more CO2 per capita than any other country on the planet. But, surely, a better method of comparison would be seeing how efficient each nation is; that is, comparing nations emissions based upon that country’s economic output, which can be measured by proxy by comparing emissions per $ of GDP. The World Resources Institute has an online database that has just such a measure (and many more). Looking at 2002, the last year available, the least efficient country is Uzbekistan, which throws out 9335.6 metric tons of CO2 per million $ of GDP. By comparison, Australia does less than a 10th of that, 694.7 metric tons per million $, just besting the world average of 706.
Here’s a graph I did comparing the emissions of several countries and the global average for the period 1982-2002:
Metric Tons of CO2 emissions per $1MM GDP
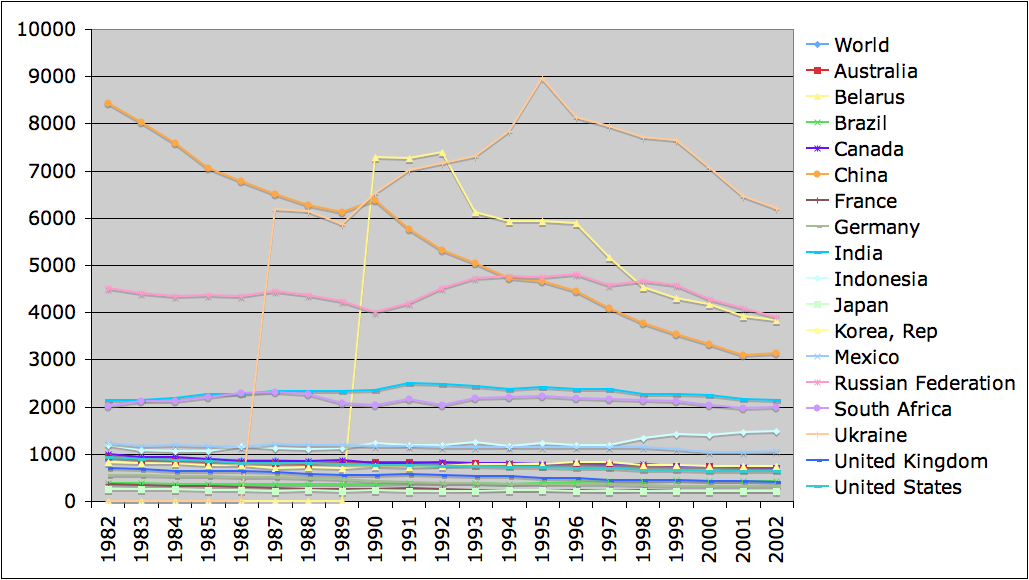
(click thumbnail for larger version)
When the very inefficient (Ukraine, Russia, Belarus, and China) and relatively inefficient (India, South Africa, Indonesia) countries are excluded, we get this graph:
Metric Tons of CO2 emissions per $1MM GDP

good through the end of the year.
Agile Web Solutions: 1Password
Register above and then download the program; they’ll email you a registration code. Signing up for the MacGems newsletter is optional.